At Slido, some of the best ideas come from our customers. And one of the most frequent things we’ve been hearing revolves around the ability to do more with the data you capture during your event.
We’ve listened and that’s why we’ve released a tool that lets you peek inside your meetings and events and extract those wonderful insights.
Introducing Analytics
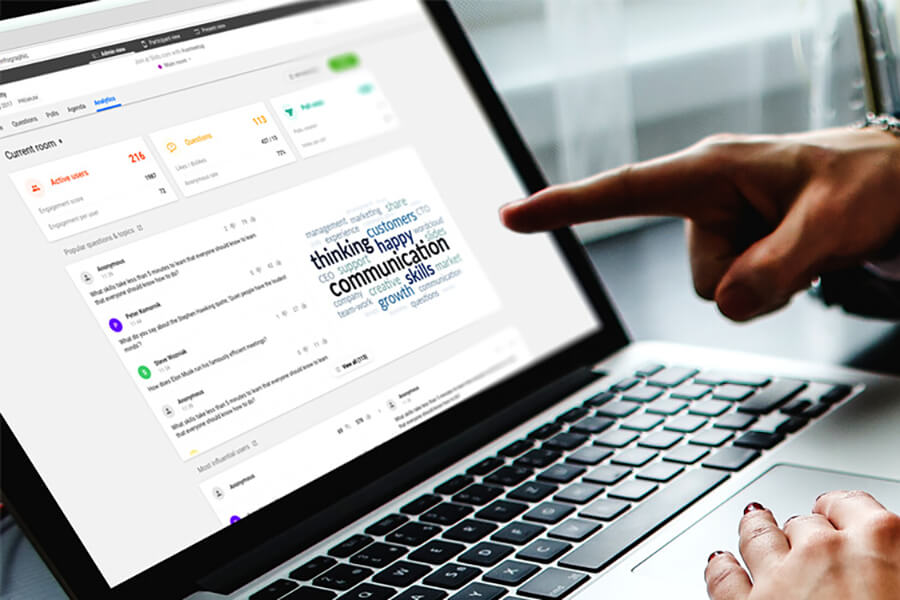
We’re thrilled to introduce the Analytics feature. You can tap into useful insights about your event, see which questions were the most popular as well as rank the most passionate and influential delegates.
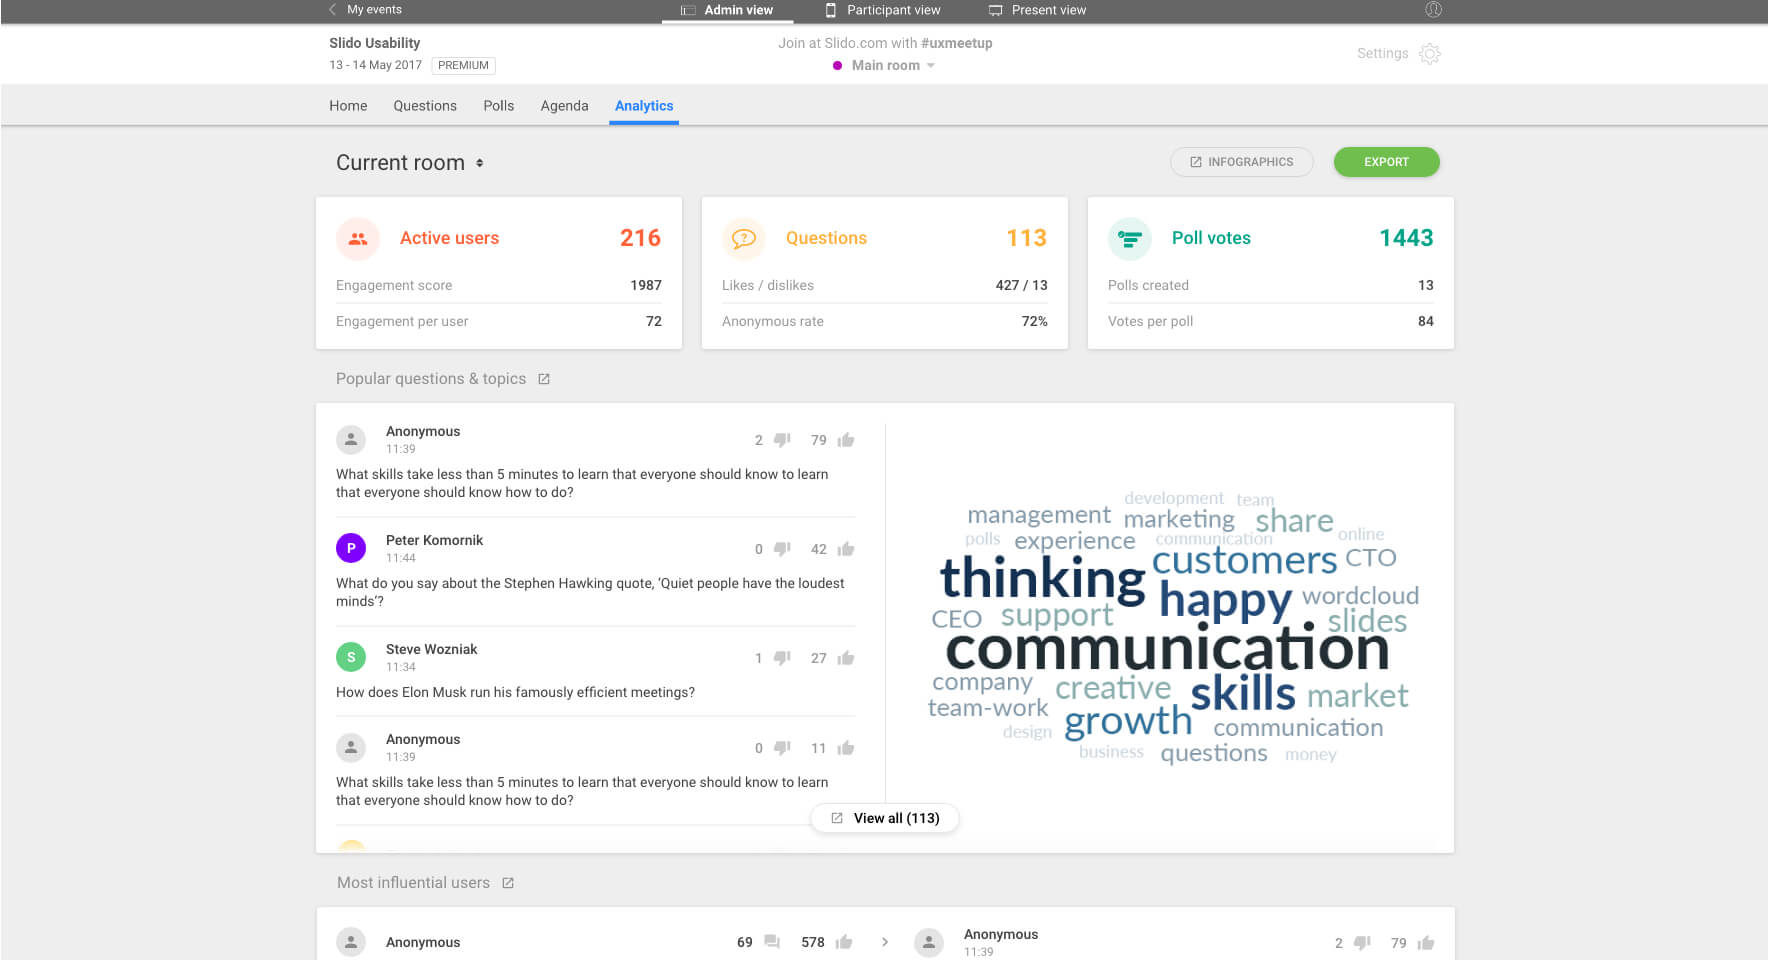
Coming up below are more details about the Analytics page. But hey, make sure you take a tour in your own event, it’s awesome.
What can you do with the new Analytics?
Export your event summary
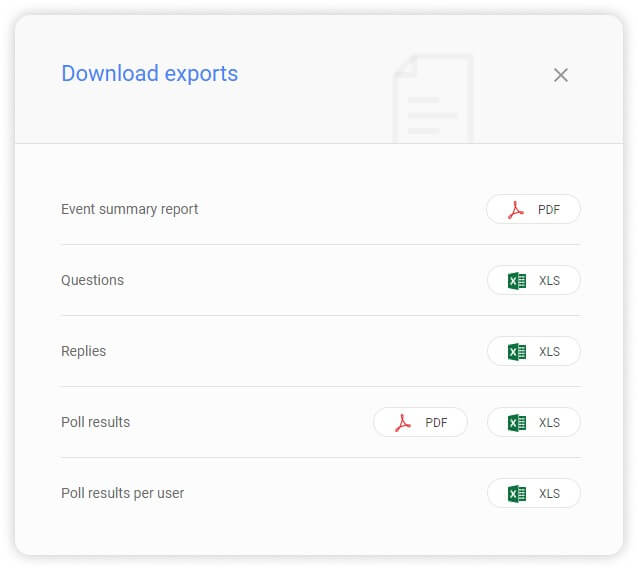
In addition to having access to the interaction data in your admin, you can now download exports directly from the Analytics page. We added a brand new Event Summary export that will allow you to see all your important stats at a glance and convert them into a PDF file.
Meet your event influencers
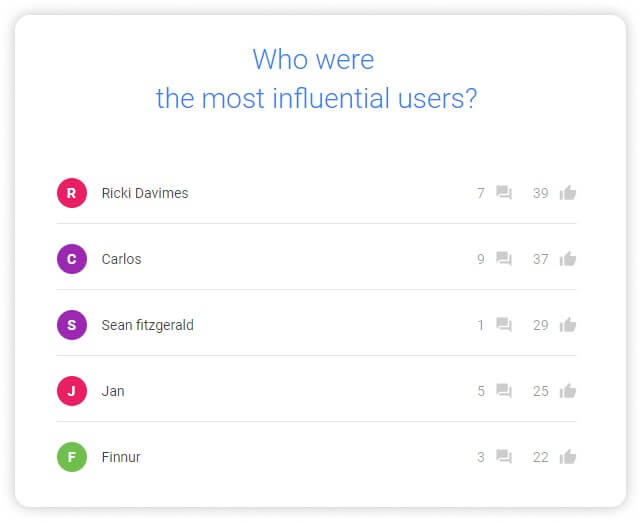
Slido Analytics will help you find the most active and passionate attendees whose questions are popular and highly upvoted.
We think they deserve a special place in Slido.
You can work with the participant ranking and weave it into the program like the Money20/20 Europe did. The organizers put a spotlight on their most influential delegates and rewarded them with a bottle of champagne.
Compare tracks
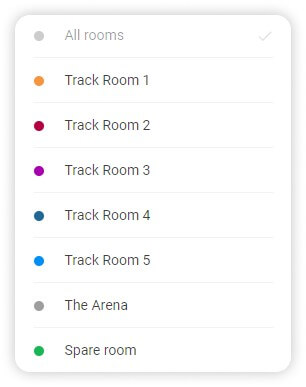
Running multiple tracks during an event can produce a truckload of questions and poll votes. You can now filter the data by tracks and see what was happening in individual rooms or cross-reference the interaction with other rooms.
Bonus: Revamped Infographics
We’ve also refreshed the look of the Infographics. With a strong attention to the data insights you need, we simplified the design and brought in a new set of helpful features.
Here’s what has been updated:
Customize your theme
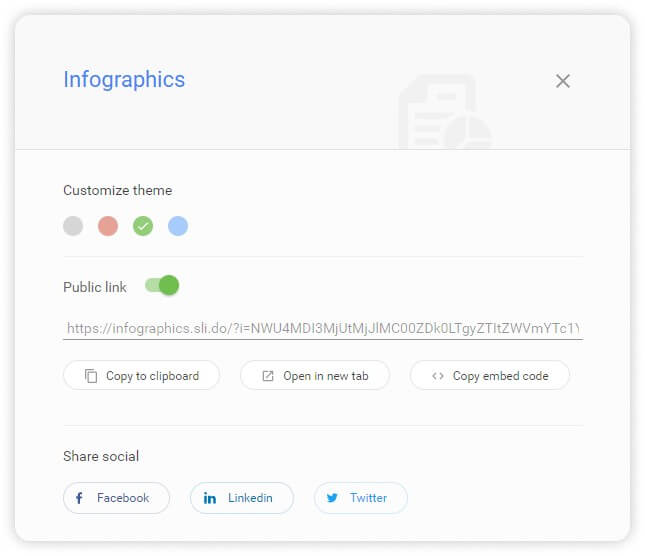
We added new color options to customize the color of your Infographics. You can now match it with your branding or simply pick your preferred one.
Share it with your audience
Using the permanent link, you can share your event stats with your colleagues or via social media channels such as Facebook, Twitter or Linkedin.
Control the privacy
You can keep the data private in which case the Infographics will be accessible only to the Admin users under your account.
Embed Infographics
This is our favorite! With the recent update, you can finally embed your Infographics into your web page or a blog post. Here’s an example:
Wrap up
We know that events rarely end when you say goodbye to your last attendee and call it a day. We hope that the new Analytics feature will help you gain new insights and make your future events even more relevant and engaging for your participants.
If you’d like to learn more or send your feedback, please let us know at support@slido.com or connect on Twitter at @slidoapp. We’d love to hear your thoughts!

